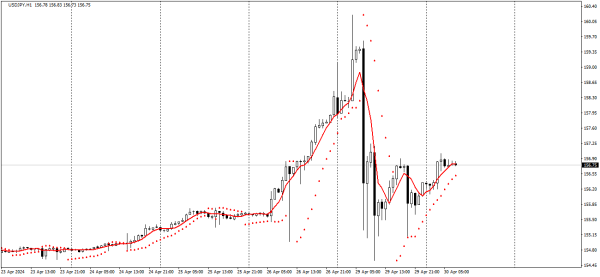
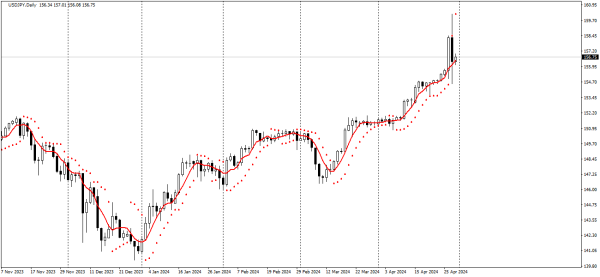
Well, I've finally reached this pair! So, we've opened the USDJPY chart on the H1 timeframe. In determining the potential price direction, Parabolic will help me. Prices of the last candle: Parabolic Price = 156.42, Candle closing price = 156.77. No matter how much I want to sell, Parabolic does not allow me to do so. It's screaming at me to BUY! No matter how much you look at the Parabolic indicator, you won't get more than 50% positive trades, so I turn to Moving Averages for help. Prices of the last candle: Moving Average Price = 156.71, Candle closing price = 156.77. The Moving Averages have told us that it's only time for buying now. No selling is possible. I will hold the trade until the stop loss, which moves along with the Parabolic. And how can we determine the overall direction without the daily chart? I can't.
*Analisis pasaran yang dipaparkan di sini hanya bertujuan untuk meningkatkan kesedaran anda, tetapi bukan sebagai petunjuk untuk anda melakukan perdagangan
 Bahasa Malay
  Русский
 English
 Bahasa Indonesia
 ไทย
ไทย Español
 Deutsch
 Български
 Français
 Tiếng Việt
 中文
中文 বাংলা
বাংলা हिन्दी
 Čeština
 Українська
 Română
Ulasan: