 English
  Русский
 Bahasa Indonesia
 Bahasa Malay
 ไทย
ไทย Español
 Deutsch
 Български
 Français
 Tiếng Việt
 中文
中文 বাংলা
বাংলা हिन्दी
 Čeština
 Українська
 Română

EUR/USD
Analysis:
The trend direction of the euro has been southward since July of last year. In the structure of a larger wave, an incomplete section forms a corrective pennant. The wave structure on the chart has formed. After a strong support zone since mid-April, the price forms an upward segment on the chart, lacking reversal potential during analysis.
Forecast:
The upcoming week is expected to see continued sideways movement for the euro. A downward vector is most probable in the first half. A reversal is expected near the support zone, followed by a resumption of upward movement.
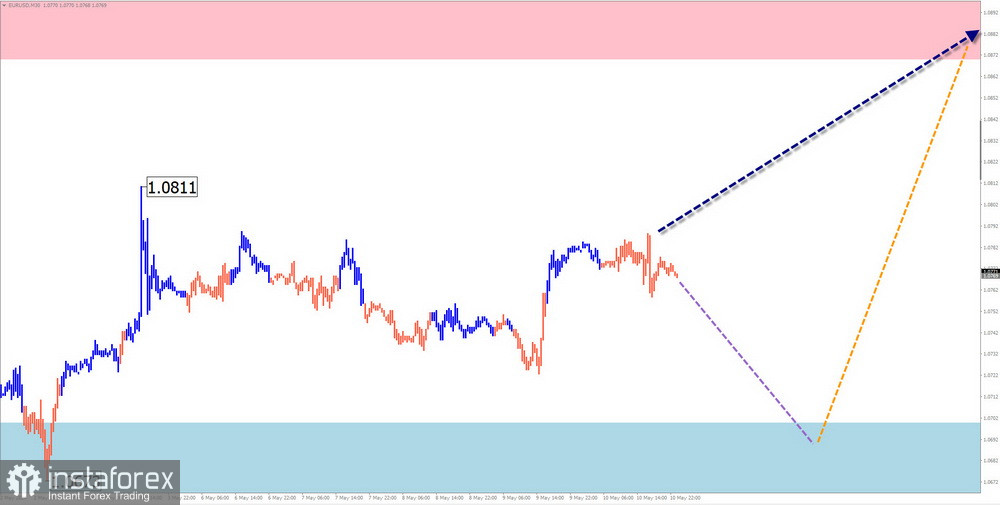
Potential Reversal Zones:
Resistance:
- 1.0870/1.0920
Support:
- 1.0700/1.0650
Recommendations:
Selling: Possible with reduced volume within individual trading sessions.
Buying: It is optimal to refrain from entering the pair market until the price decline is complete, tracking reversal signals from the resistance zone.
USD/JPY
Analysis:
The main direction of the price movement of the major Japanese yen pair has been set by a bullish wave since December of last year. Since late April, the price has been forming a corrective structure. The upward segment that started on May 2 has reversal potential. Confirmation of this would mark the beginning of the final part of the main wave.
Forecast:
The upcoming week is expected to continue the overall sideways movement. A downward course is not ruled out in the first few days, not falling below the calculated support boundaries. Towards the end of the week, there is an increased probability of increased volatility, a change in direction, and the start of a price increase. The resistance zone indicates the upper boundary of the expected weekly movement of the pair.
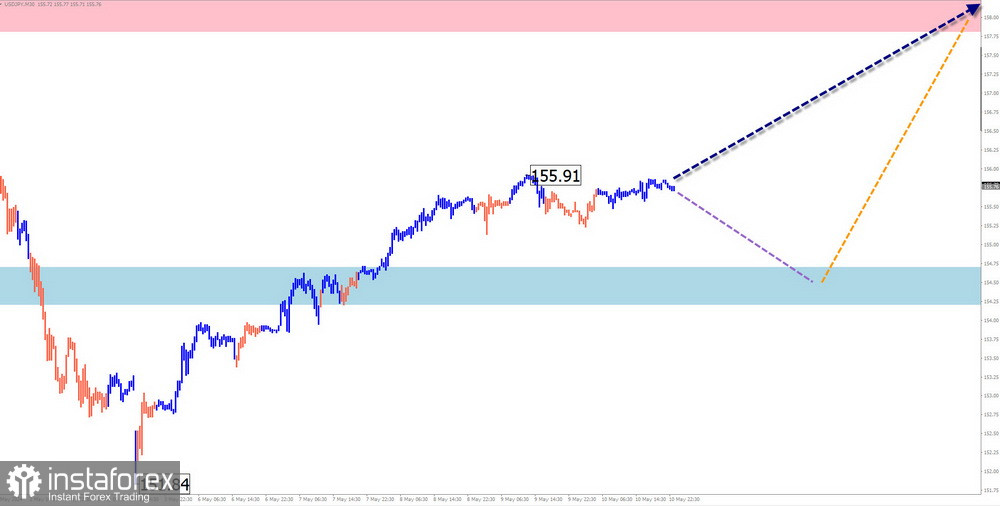
Potential Reversal Zones:
Resistance:
- 157.80/158.30
Support:
- 154.70/154.20
Recommendations:
Buying: Deals may be profitable only within individual sessions. It is safer to use fractional volumes.
Selling: This will be possible after the appearance of confirmed reversal signals in the vicinity of the resistance zone, confirmed by your trading systems.
GBP/JPY
Analysis:
On the pair's chart, the most significant interest is represented by the current upward wave since December 7 of last year. The structure forms the middle part (B). After breaking through the powerful resistance zone at the end of April, the price consolidates above it for further upward movement.
Forecast:
In the coming days, continuing price movement in a sideways plane is probable. Pressure on the support zone is possible with a brief breach of its lower boundary. Towards the end of the week, volatility is expected to increase, the direction to change, and the bullish movement to resume.
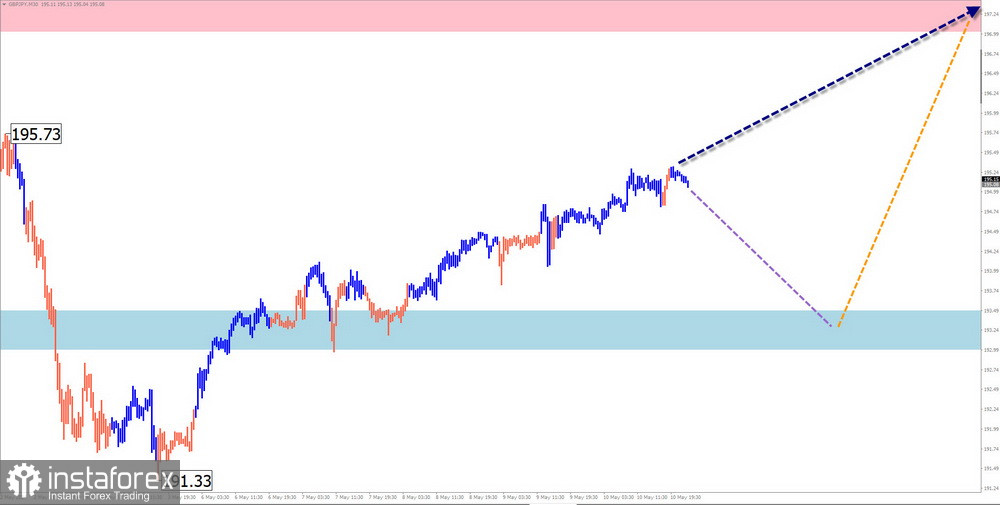
Potential Reversal Zones:
Resistance:
- 197.00/197.50
Support:
- 193.50/167.50
Recommendations:
Selling: Fractional volumes may be possible within individual trading sessions in the pair market. The potential is limited by support.
Buying: Only conditions for purchases will exist once the current decline is complete. Deals will become relevant after confirmed buying signals appear in the support zone.
USD/CAD
Analysis:
The dominant upward wave on the chart of the leading Canadian dollar pair since the end of December last year shows signs of completion. The downward movement that started a month ago has the potential for a full correction. Price extremes on the chart have formed a "descending pennant" pattern. The wave structure does not indicate completion.
Forecast:
During the upcoming weekly period, price movement is expected within a corridor between the nearest zones in the opposite direction. An attempt to pressure the resistance zone can be expected in the first few days. In the second half of the week, a reversal and a resumption of downward price movement can be anticipated.
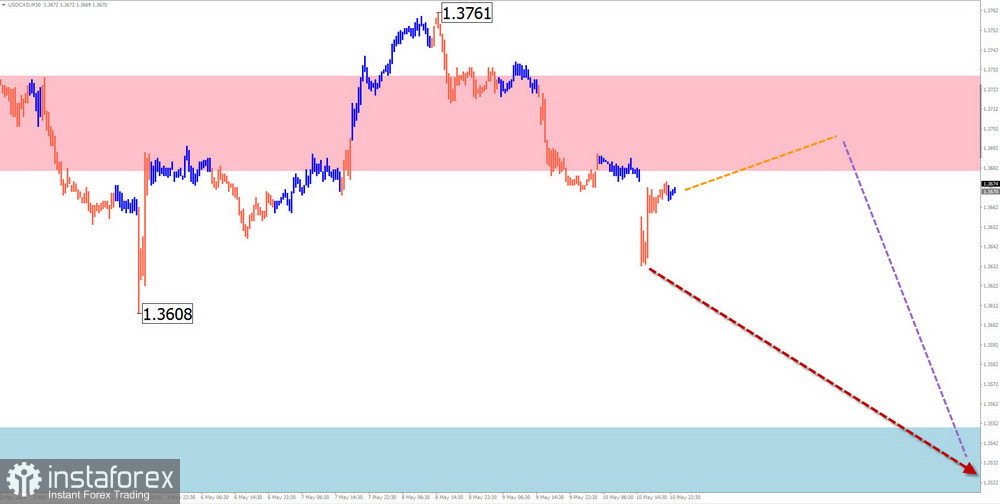
Potential Reversal Zones:
Resistance:
- 1.3680/1.3730
Support:
- 1.3550/1.3500
Recommendations:
Buying: Lack potential and may lead to deposit losses.
Selling: May be used in trading after the appearance of confirmed reversal signals in the vicinity of the resistance zone, confirmed by your trading systems.
NZD/USD
Brief Analysis:
In the dominant downward wave structure of the New Zealand dollar since July of last year, the final part (C) has been forming since the beginning of this year. Quotes move within a narrow corridor between powerful support-resistance levels over large time frames. The entire past monthly period in this wave saw a corrective movement.
Weekly Forecast:
In the upcoming week, the completion of upward price movement can be expected. Temporary pressure on the resistance zone is not excluded. A change in direction and a resumption of price decline are expected afterward. The calculated support runs along the upper boundary of a powerful potential reversal zone on the weekly chart.
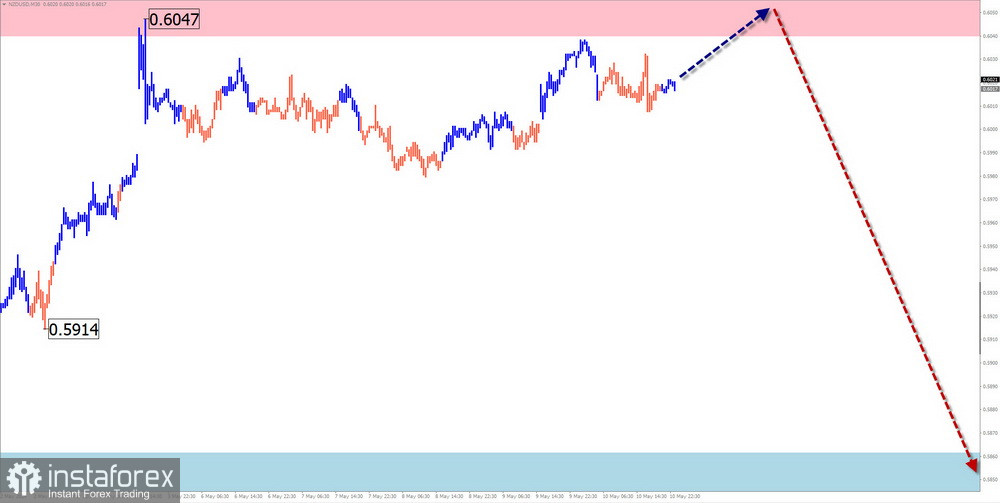
Potential Reversal Zones:
Resistance:
- 0.6040/0.6090
Support:
- 0.5860/0.5810
Recommendations:
Buying: Prospects are bleak in the coming days.
Selling: This may become the main direction of trading deals after the appearance of reversal signals near the resistance zone. The calculated support limits the potential.
Gold
Analysis:
The upward wave continues on the gold chart. Having reached the boundaries of a powerful potential reversal zone, gold prices have entered a horizontal drift since December of last year. The structure of the corrective wave does not appear to be formed today.
Forecast:
In the upcoming week, continued overall sideways gold movement can be expected. A decline in support boundaries is more probable in the first few days. A reversal and a resumption of price increases are expected in the subsequent days. A brief breach of the lower boundary of support is not excluded with a change in direction.
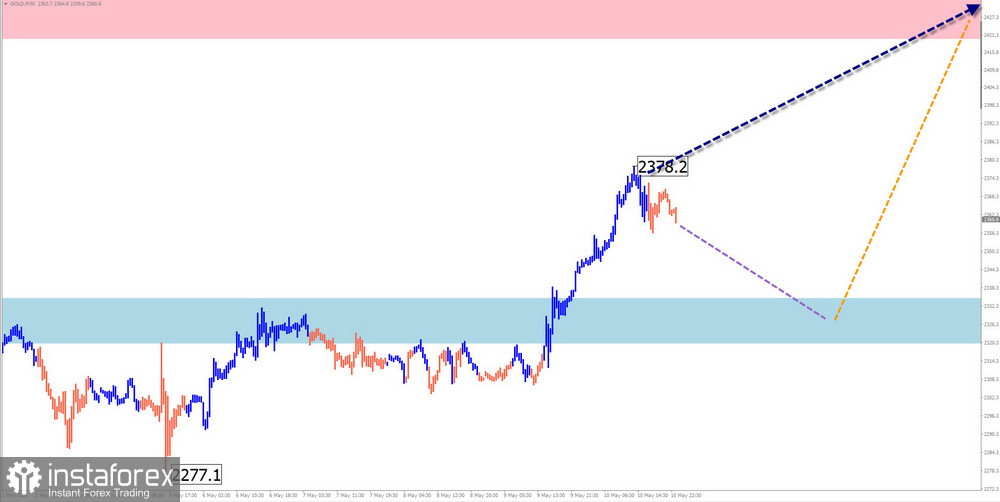
Potential Reversal Zones:
Resistance:
- 2420.0/2435.0
Support:
- 2335.0/2320.0
Recommendations:
Selling: Possible with reduced volume within intraday trading. The support area limits the potential.
Buying: May be used in trading after confirmed reversal signals appear on your trading systems.
Explanation: In simplified wave analysis (SWA), all waves consist of 3 parts (A-B-C). The latest, unfinished wave is analyzed on each timeframe. Dotted lines indicate expected movements.
Attention: The wave algorithm does not consider the duration of instrument movements over time!