 English
  Русский
 Bahasa Indonesia
 Bahasa Malay
 ไทย
ไทย Español
 Deutsch
 Български
 Français
 Tiếng Việt
 中文
中文 বাংলা
বাংলা हिन्दी
 Čeština
 Українська
 Română

Analysis of EUR/USD 5M
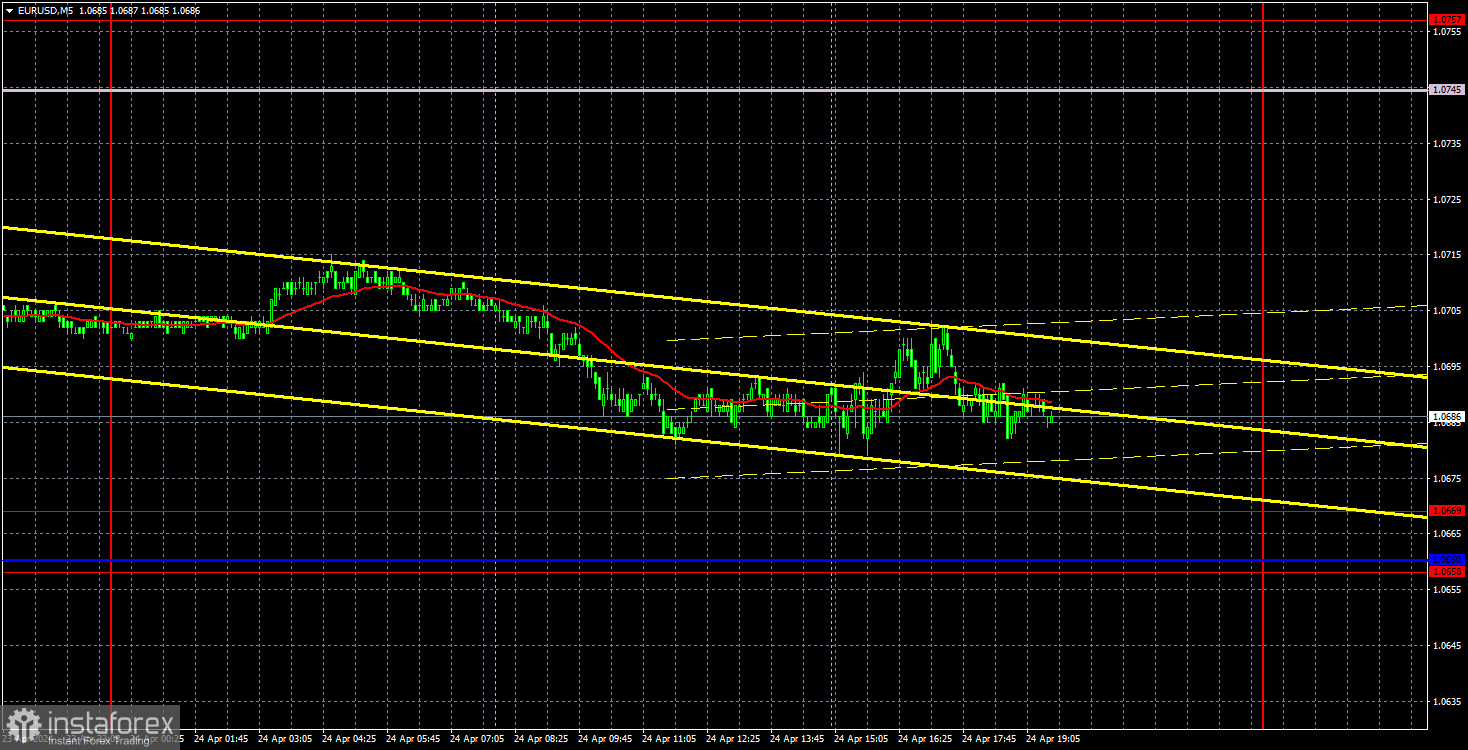
EUR/USD continued to move within an almost horizontal, but formally known as an ascending channel. Since the last bounce occurred from the lower boundary of the channel, the price rose to the upper boundary over the course of several days. Now, the price could fall to the lower boundary of the channel as it has bounced from the upper boundary. Speaking of the logic behind yesterday's movement, it was likely reasonable. The market had witnessed quite resonant reports on business activity in Germany, the EU, and the US. Yesterday, however, only secondary IFO indices and a fairly important report on US durable goods orders were published. However, the values of this indicator turned out to be almost completely in line with forecasts, so there was nothing for the market to react to. And we saw another day with volatility of about 40 pips...
As for the technical picture, the pair continues to correct higher, as indicated by the channel. It may continue for some time, but the euro still has prospects to fall in the medium-term. The market cannot constantly sell the pair, even amidst a downtrend.
No trading signals were formed on Wednesday. From our perspective, this is actually a good thing because volatility was low, and even if signals had formed, it would have been quite difficult to expect any profit. Take note that the euro is nearly trading flat at the moment. A small upward slope is seen on the channel. In general, it is always difficult and even unprofitable to trade in a flat market.
COT report:
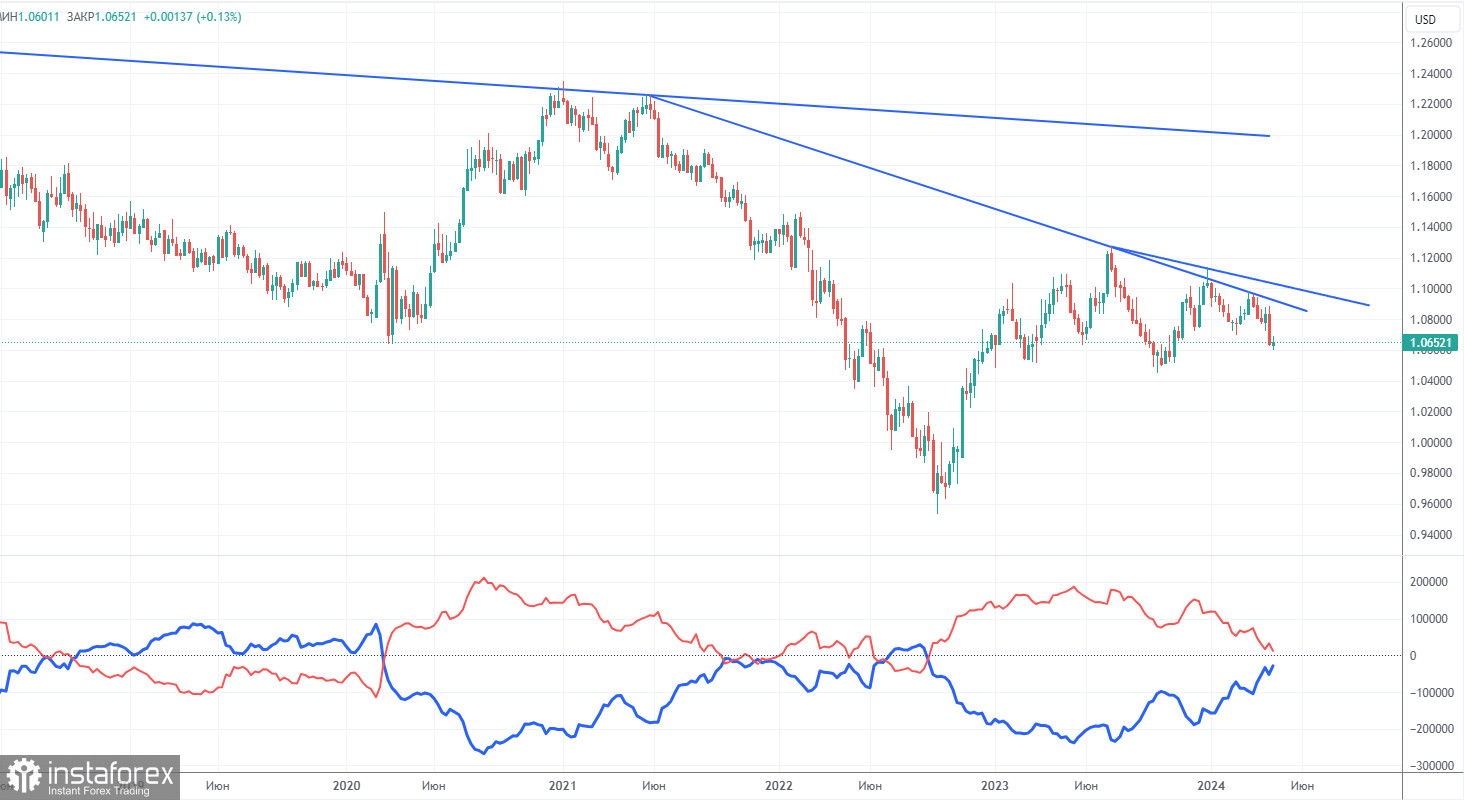
The latest COT report is dated April 16. The net position of non-commercial traders has been bullish for quite some time. Basically, the number of long positions in the market is higher than the number of short positions. However, at the same time, the net position of non-commercial traders (red line) has been decreasing in recent months, while that of commercial traders (blue line) has been increasing. This shows that market sentiment is turning bearish, as speculators increasingly sell the euro. Furthermore, we don't see any fundamental factors that can support the euro's strength, while technical analysis also suggests a downtrend. Three descending trend lines on the weekly chart indicate that there's a good chance of sustaining the decline.
At present, the red and blue lines are moving towards each other (indicating a trend reversal after a rise). Therefore, we believe that the euro will fall further. During the last reporting week, the number of long positions for the non-commercial group increased by 3,500, while the number of short positions increased by 21,500. Accordingly, the net position decreased by 21,500. Overall, both the euro and the net position continue to decline. The number of buy contracts is higher than the number of sell contracts among non-commercial traders by only 12,000 (previously 32,700).
Analysis of EUR/USD 1H
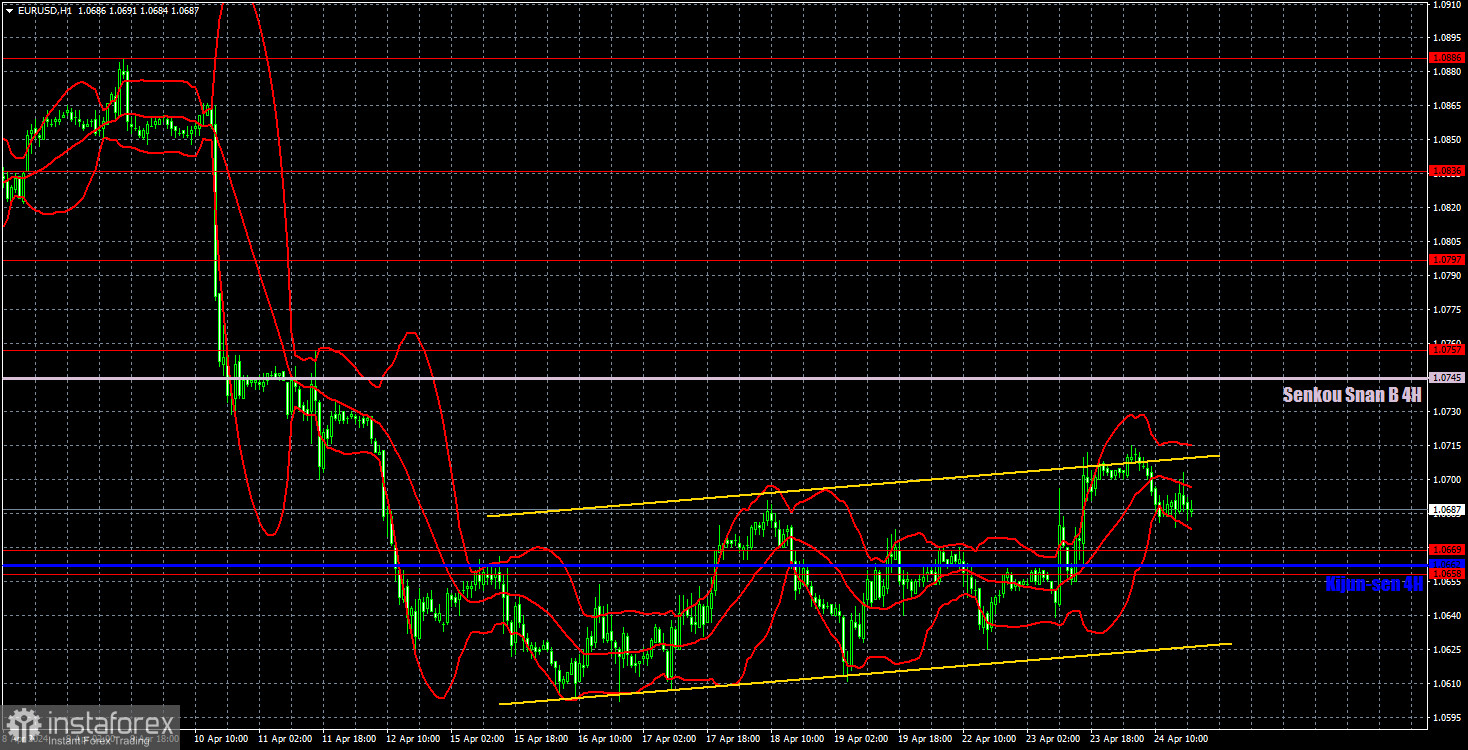
On the 1-hour chart, the downtrend persists but EUR/USD has remained in a flat phase for a week now. Since expectations for a Federal Reserve rate cut in 2024 have significantly decreased, the US dollar can and should continue to rise for a couple more months. Therefore, we should wait for the end of the current correction, afterwards, traders may reconsider selling the pair. The targets in the 1.00-1.02 range remain unchanged for now.
On April 25, we highlight the following levels for trading: 1.0530, 1.0581, 1.0658-1.0669, 1.0757, 1.0797, 1.0836, 1.0886, 1.0935, 1.1006, 1.1092, as well as the Senkou Span B line (1.0745) and the Kijun-sen line (1.0662). The Ichimoku indicator lines can move during the day, so this should be taken into account when identifying trading signals. Don't forget to set a Stop Loss to breakeven if the price has moved in the intended direction by 15 pips. This will protect you against potential losses if the signal turns out to be false.
On Thursday, there are no significant events planned in the European Union, while the US will release reports on GDP for the first quarter and initial unemployment claims. The market may react to the GDP report, as it is the first estimate. But only if there is a significant deviation (at least 0.2%) from the forecast value (2.5% q/q).
Description of the chart:
Support and resistance levels are thick red lines near which the trend may end. They do not provide trading signals;
The Kijun-sen and Senkou Span B lines are the lines of the Ichimoku indicator, plotted to the 1H timeframe from the 4H one. They provide trading signals;
Extreme levels are thin red lines from which the price bounced earlier. They provide trading signals;
Yellow lines are trend lines, trend channels, and any other technical patterns;
Indicator 1 on the COT charts is the net position size for each category of traders;