 English
  Русский
 Bahasa Indonesia
 Bahasa Malay
 ไทย
ไทย Español
 Deutsch
 Български
 Français
 Tiếng Việt
 中文
中文 বাংলা
বাংলা हिन्दी
 Čeština
 Українська
 Română

Analysis of EUR/USD 5M
EUR/USD kicked off the new week by trying to continue its upward movement. However, it failed, as there was no fundamental or macroeconomic background, and over the past weeks, the market has received enough information to have a clear understanding of how to trade in the near future. Unfortunately, it is very difficult to say what decision the majority of market participants have made. The EUR/USD pair has been going through a corrective phase for several weeks now. Not that it's particularly upsetting or discouraging, but it would be nice to see a trend more frequently rather than waiting for weeks for the correction to end.
Nevertheless, from a technical perspective, the short-term upward trend persists, leaving only two options. Either wait for the trend to change to a downward one and expect the euro to start a new sharp decline, or try to earn 10-20 pips a day on the upward movement, which could end at any moment. Take note that practically all the recent US economic reports have been disappointing, but at the same time, the fundamental background works in favor of the dollar. Therefore, we believe that it was logical for the dollar to fall recently, but at the same time, we expect the greenback to show a new phase of strength in the medium term.
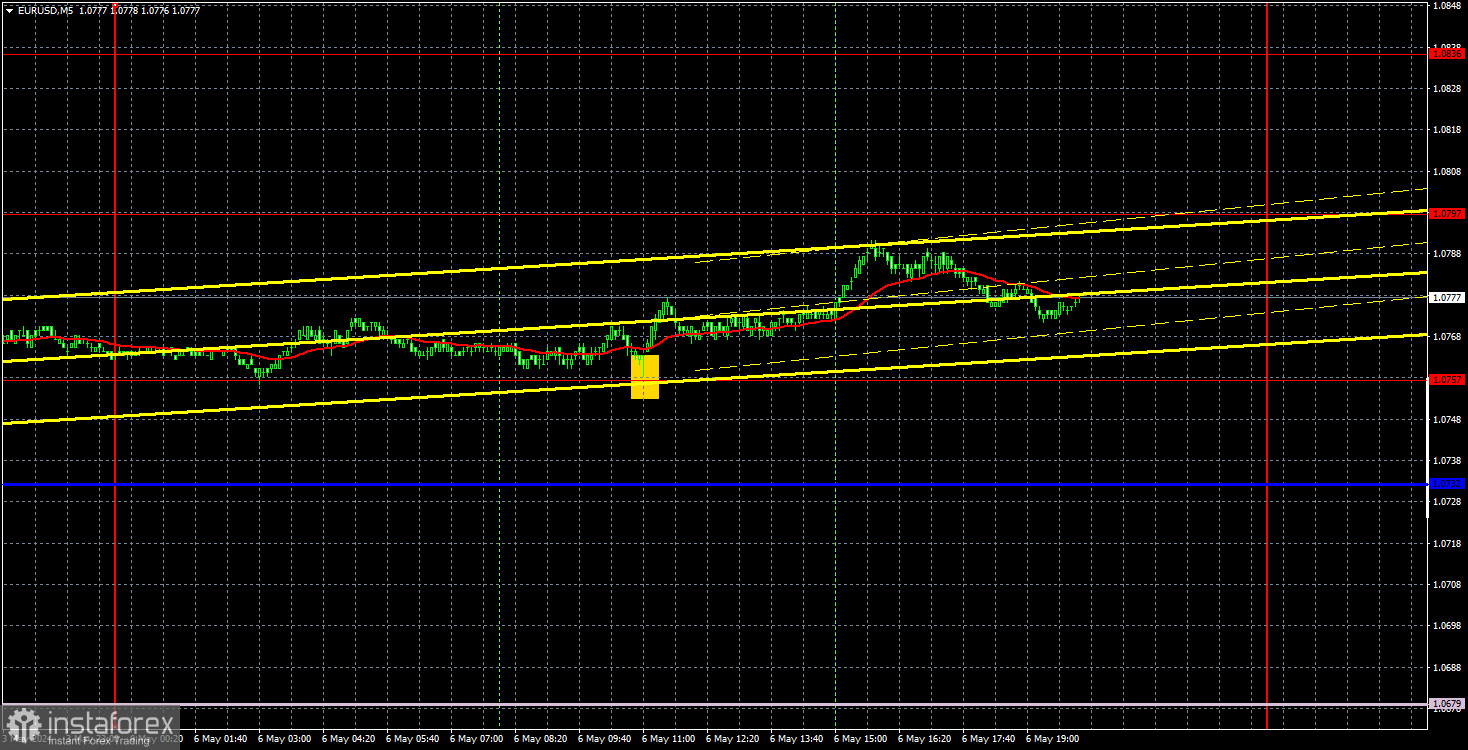
Only one trading signal was formed on Monday. During the European trading session, the pair bounced off the level of 1.0757, after which it managed to rise by about 25 pips at its peak. Volatility was low, as it often happens on Mondays. In the European Union, second estimates of two business activity indexes for the services sectors of Germany and the EU for April were published, which turned out to be slightly better than the first ones. The pair edged up, but who would be interested in just 12 pips?
COT report:
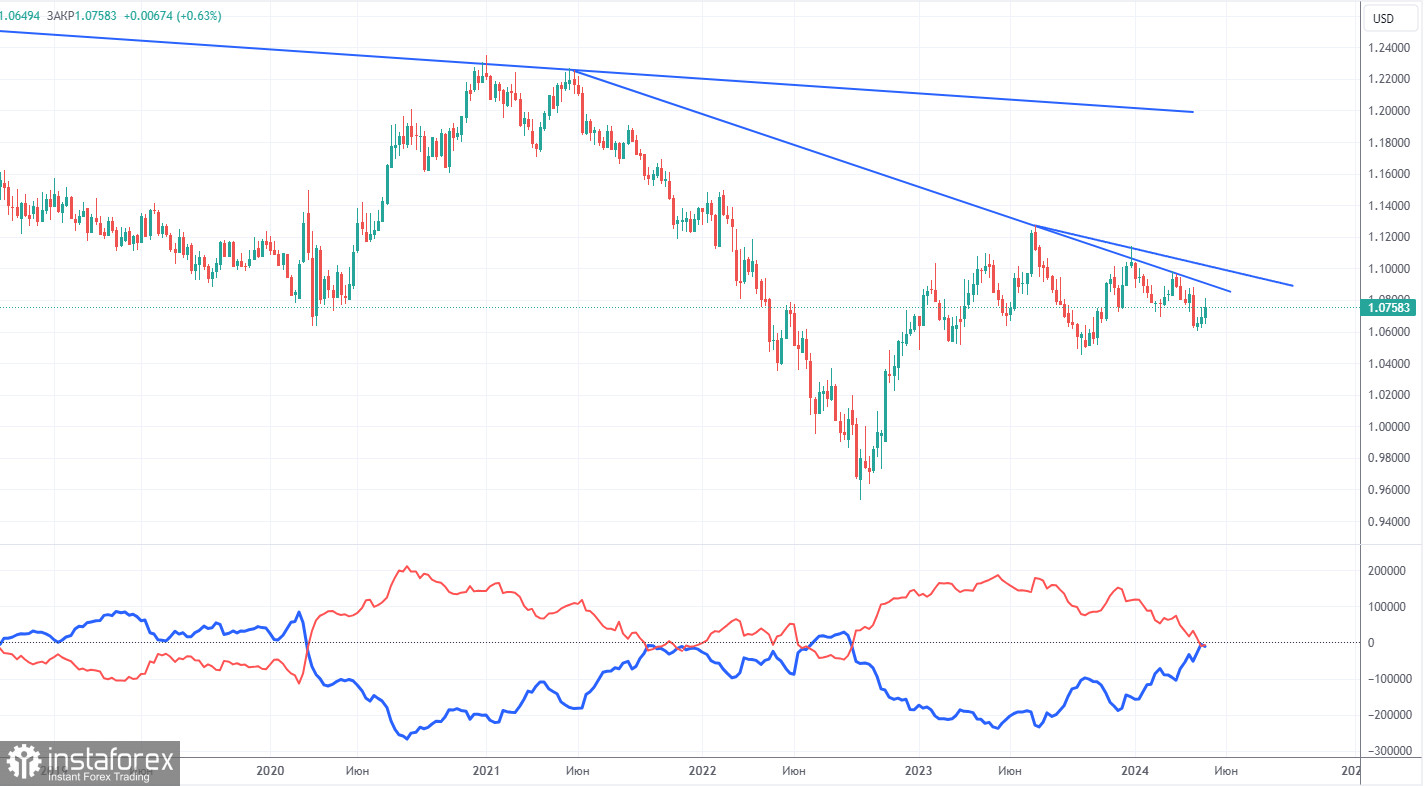
The latest COT report is dated April 30. The net position of non-commercial traders has been bullish for quite some time, but now the situation has finally changed. The net position of non-commercial traders (red line) has been decreasing in recent months, while that of commercial traders (blue line) has been increasing. This shows that market sentiment is turning bearish, as speculators increasingly sell the euro. Currently, their positions coincide in terms of volume. We don't see any fundamental factors that can support the euro's strength, while technical analysis also suggests a downtrend. Three descending trend lines on the weekly chart indicate that there's a good chance of sustaining the decline.
The red and blue lines have crossed, and now bears may have a significant advantage. So we strongly believe that the euro will fall further. During the last reporting week, the number of long positions for the non-commercial group decreased by 100, while the number of short positions decreased by 3,200. Accordingly, the net position increased by 3,100. Overall, both the euro and the net position continue to decline. The number of buy contracts is now lower than the number of sell contracts among non-commercial traders by 7,000.
Analysis of EUR/USD 1H
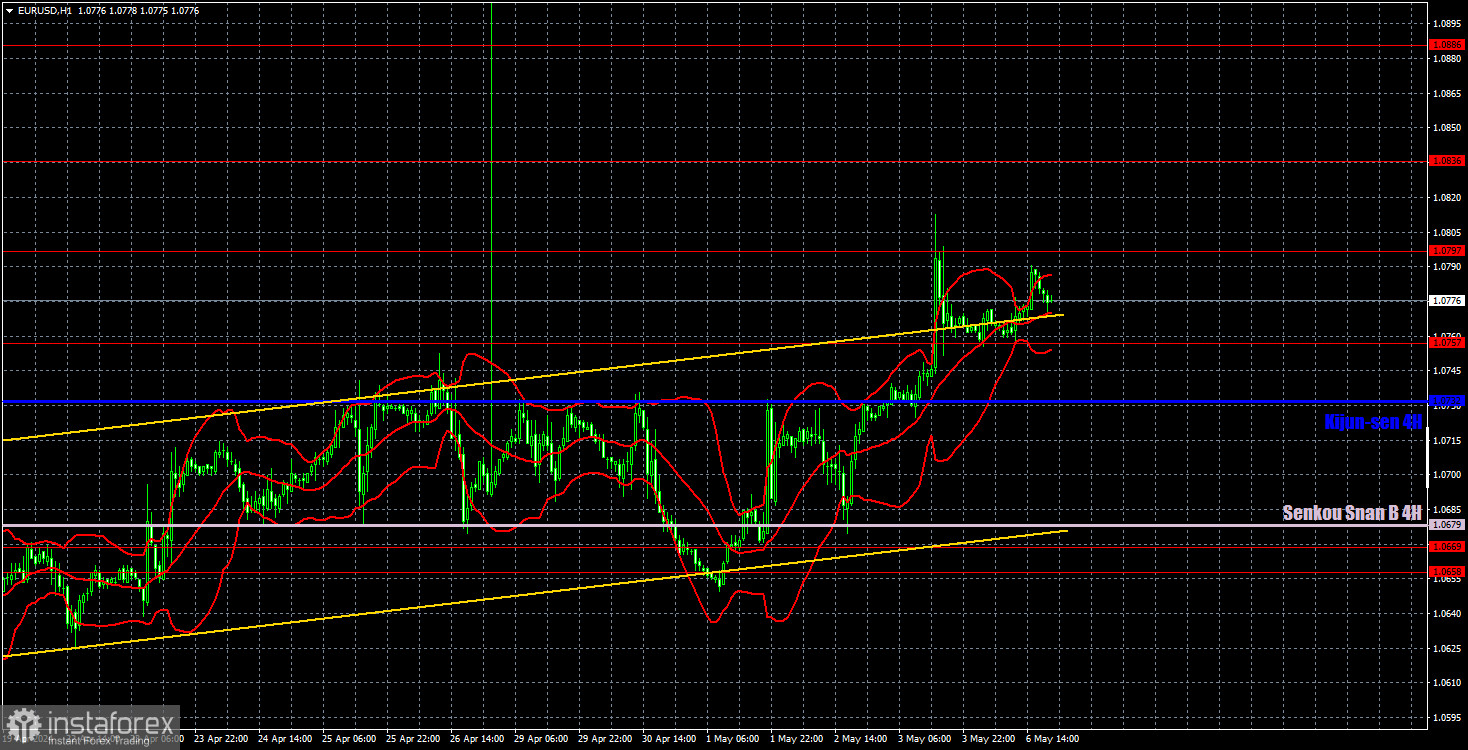
On the 1-hour chart, the downtrend persists but EUR/USD has remained in a flat phase for two weeks. Since expectations for a Federal Reserve rate cut in 2024 have significantly decreased, the US should rise in the medium term. Therefore, we simply need to wait for the end of the current correction before we consider selling the pair. The targets in the 1.00-1.02 range remain unchanged for now.
On May 7, we highlight the following levels for trading: 1.0530, 1.0581, 1.0658-1.0669, 1.0757, 1.0797, 1.0836, 1.0886, 1.0935, 1.1006, 1.1092, as well as the Senkou Span B line (1.0679) and the Kijun-sen line (1.0732). The Ichimoku indicator lines can move during the day, so this should be taken into account when identifying trading signals. Don't forget to set a Stop Loss to breakeven if the price has moved in the intended direction by 15 pips. This will protect you against potential losses if the signal turns out to be false.
On Tuesday, we will only highlight reports on the trade balance in Germany and retail sales in the European Union. Both reports could, at best, provoke a market reaction of 20-25 pips. Most likely, we will see low volatility again.
Description of the chart:
Support and resistance levels are thick red lines near which the trend may end. They do not provide trading signals;
The Kijun-sen and Senkou Span B lines are the lines of the Ichimoku indicator, plotted to the 1H timeframe from the 4H one. They provide trading signals;
Extreme levels are thin red lines from which the price bounced earlier. They provide trading signals;
Yellow lines are trend lines, trend channels, and any other technical patterns;
Indicator 1 on the COT charts is the net position size for each category of traders;